
Harbor Surge Forecast : Haleʻiwa, Oʻahu
This forecast is temporarily not updating. Please check back later for new data.
Caution: The forecast below is experimental and no promise of accuracy is implied. The forecast is explicitly not accurate whenever a tsunami, tropical storm or cyclone watch/warning is in effect. For these events, please seek information for either tsunamis or tropical storms/hurricanes.

The Dark Blue Curve shows the Surge Current Index based on observed swell amplitudes (waves of 3-30 second periods) off the North Shore of Oʻahu for the last 3 days. The Index is based on the amplitudes of infragravity waves (2-40 minute periods) excited in the harbor by the incoming swell. The Solid Cyan Curve shows the forecast Surge Current Index, based on forecast swell amplitudes (waves of 3-30 second periods) off the North Shore of Oʻahu.
The Dotted Cyan Curve shows the last forecast Surge Current Index made for that date/time (usually, less than a few hours into the future). The dotted line provides a crude visual indication of the accuracy of the forecasts in comparison with the Surge Current Index derived from actual swell observations (solid blue curve).
When the Surge Current Index exceeds the Red Line, past events have shown that currents within Haleʻiwa Harbor have been strong enough to cause damage to boats and infrastructure due to the jostling of boats and floating docks. Also, safe navigation becomes problematic. If the Surge Current Index reaches the Shaded Area, currents within Haleʻiwa Harbor may be strong enough to cause some damage to boats and infrastructure and safe navigation may become challenging.
Harbors are intended to protect boats and other floating platforms from being ripped from moorings or battered against docks by wave-driven currents, often called “surges”, and swell waves. The PacIOOS Harbor Surge Forecast provides advance notice of potentially dangerous surges in Hawaiian harbors, allowing boaters to take precautionary measures to secure their vessels.
Harbors provide safe haven from short-period swell waves (3 to 30 seconds) by effectively damping the swell through an arrangement of barrier jetties and channels. However, these familiar, often large, swell waves that challenge surfers along Hawaiʻi’s coasts are associated with strong currents that add to their danger to maritime activities.
As the swell waves interact with the coast they also produce currents at longer periods, including rip-currents, which are well known to beachgoers. These longer-period currents more easily invade harbors than the shorter-period swell waves, behaving very much like tsunamis. The PacIOOS Harbor Surge Forecast is the result of developing an empirical and theoretical understanding of how swell waves produce currents at all periods within Hawaiian harbors. The forecast is updated hourly (about 15 minutes after the hour) and dates and times are shown in local time.
Contact
For more information, please contact Assaf Azouri. The Harbor Surge Forecast Tool was developed by A. Azouri, D. Luther, and M. Guiles within the Department of Oceanography in the School of Ocean and Earth Science and Technology (SOEST) at the University of Hawaiʻi at Mānoa.
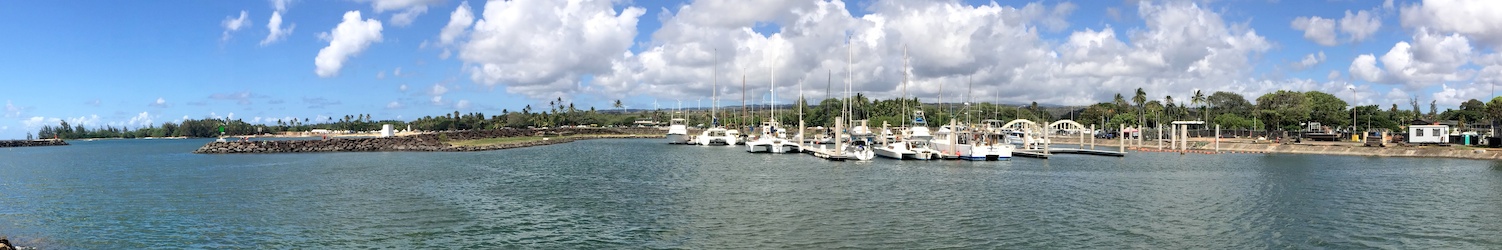
The photos below show different parts of Haleʻiwa Harbor during a large swell event on February 22, 2016, on the North Shore of Oʻahu, Hawaiʻi. The comparisons show the impacts of the surge within the harbor.
 |
 |
 |
 |
 |
 |
|
|
|
|
|
|
The video shows a time-lapse of the above event on February 22, 2016, at Haleʻiwa Harbor. The oscillations inside the harbor were predominantly at infragravity periods ranging between 4-6 min.
Observed and Forecast Surge Current Index
The Dark Blue Curve is the Surge Current Index based on observed swell amplitudes (waves of 3-30 second periods) off the North Shore of Oʻahu for the last 3 days. The Index is based on the amplitudes of infragravity waves (2-40 minute periods) excited in the harbor by the incoming swell. The relationship between impinging swell and infragravity wave variability as a function of period was determined from a 6-month experiment in 2011-2012 that collected current and wave data inside and outside the harbor.
The Solid Cyan Curve shows the forecast Surge Current Index, based on forecast swell amplitudes (waves of 3-30 second periods) off the North Shore of Oʻahu. The forecast Index is calculated in a manner identical to that just described for the “observed” Index, except that the input is forecast swell energies rather than observed swell energies. The swell forecast is hourly and is updated once a day.
The Dotted Cyan Curve shows the last forecast Surge Current Index made for that date/time (usually, less than a few hours into the future). The dotted line provides a crude visual indication of the accuracy of the forecasts in comparison with the Surge Current Index derived from actual swell observations (solid blue curve).
Historically, when the Surge Current Index exceeds the Red Line, currents within Haleʻiwa Harbor have been strong enough to cause damage to boats and infrastructure due to the jostling of boats and floating docks. Also, safe navigation becomes problematic. In order to determine this line for the Surge Current Index, the most energetic swell events (two from each year) and all tsunami events that occurred during the years 1997-2010 were analyzed. The Indices for the events that resulted in the most significant damage to harbor infrastructure and/or boats defined the level for the red line (the damage level was determined from historical media reports). Validation of this definition is ongoing via additional data collection.
Components of the Observed and Forecast Surge Current Index

The four different colors indicate the relative contributions to the Surge Current Index from the infragravity waves in each of the four period bands (see legend within the figure). The Observed and Forecast solid lines, as well as the dotted lines, have the same meanings as in the above graph for each of the four individual period bands.
Observed and Forecast Swell Energy Flux Toward the North Shore

This figure shows the observed (left of vertical red line) and forecast (right of red line) energy flux toward the North Shore of the wind-generated gravity waves (3-30 second periods) as a function of period and time at the location of the PacIOOS Waimea Wave Buoy (~4 miles NW of Waimea Bay). The observed values are based on wave energy and direction products from the wave buoy as calculated by Coastal Data Information Program (CDIP). The forecast values are based on a PacIOOS model output. The ordinate axis is swell period in units of seconds.
An archive of previous forecast plots can be accessed below. Select a day of interest from the calendar, or use the slider tool to quickly navigate through all available images. Two historical forecast plots are provided for each day, generated at 6:00 AM and 6:00 PM of the local time zone. To view the most recent forecast and to learn more about the different components of the graph, please go to the Forecast tab.
date: :
Loading archive...


